Infographics are used in many ways. In the news, they are used to report poll results and other fast facts. In finance, they are used to report gains and losses. You can even find infographics about how to make a successful infographic:

From Visually.
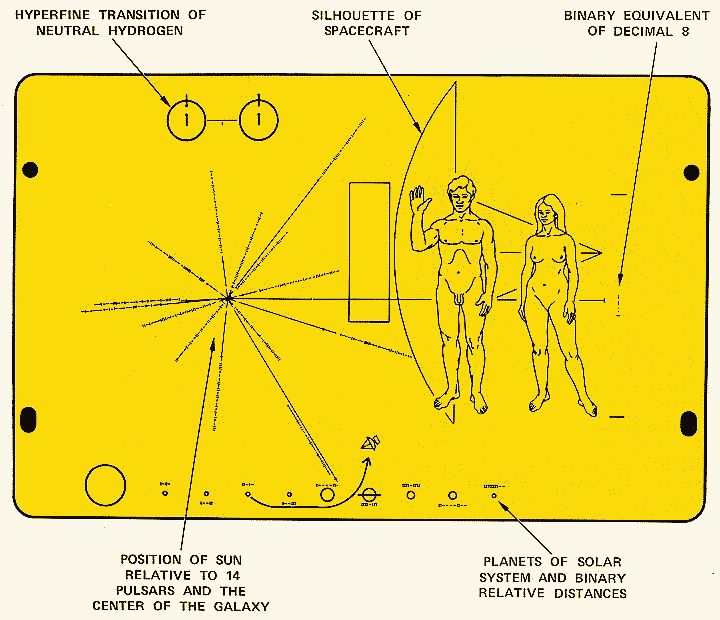
USA Today gets the credit for popularizing the infographic but they have been around practically since the dawn of time. All over the world, humans have documented their journey with carvings and visual representations of their trek. A great example most people are familiar with is the Egyptians use of hieroglyphics (Hagen & Golombisky, 2017). NASA even used an infographic when they sent out the Pioneer space probes. (Howell, 2012)
When to use Infographics
Infographics are helpful when you need to convey information quickly. They are also helpful if there is an auditory barrier. Also you should consider using an infographic where the audience does not read or write the language very well or at all. (Hagen & Golombisky, 2017). Simple examples you may run across every day include warning signs that have both a written and visual element.

things to keep in mind
When designing an infographic there are a few things to keep in mind. First and foremost, the infographic must stand on its own. It must be researched, unified in its appearance and clear to user. The designer cannot assume the audience understands the material, they must test it before final publication. (Hagen & Golombisky, 2017)
Conclusion
When you think infographic you may think pie charts, bar graphs and nightly news but there are so many other uses. As briefly discussed in this post infographics are used in many places. You just need to know your audience and what information needs to be conveyed. Keep it clear and keep it unified and you will have a successful learning tool.
Resources
Hagen, R., & Golombisky, K. (2017). White space is not your enemy: a beginners guide to communicating visually through graphic, web & multimedia design. Boca Raton, FL: CRC Press, Taylor & Francis Group.
Howell, E. (2012, September 18). Pioneer 10: Greetings from Earth. Retrieved from https://www.space.com/17651-pioneer-10.html.

Michele,
This is really good. I know where to go when I need information about infographics. Not all infographics are created equally. Some are very interesting and some have a lot going on, meaning a busy page of work but you are right we have to know our audience. Creating them are fun and easy, but some we have to put our creative thinking caps on and go to work. Thank you for sharing this good information.
Regina
LikeLike